Boost Your ELB Insights with S3 Access Logs
What is S3?
Amazon Simple Storage Service (S3) is a scalable storage service offered by AWS. It allows users to store and retrieve any amount of data, whenever they need it. It’s ideal for anything from backups and archiving to big data analytics and static website hosting.

What are S3 Buckets?
S3 buckets are the containers that hold your data within Amazon S3. Think of them as cloud folders where you store files or objects. Each bucket is globally unique, and you can organize your data with a flat namespace. In this post, I’ll show you how to set up an S3 bucket for your ELB access logs.
Creating an S3 Bucket
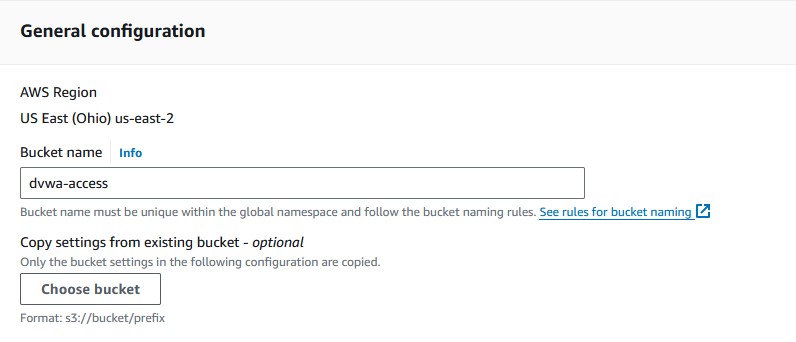
Search for 'S3' in the search bar and access the S3 management console. Click on 'Create bucket'.
Follow these steps:
- Give your bucket a name.
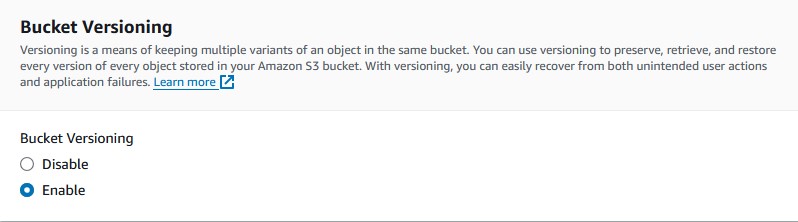
- Make sure bucket versioning is enabled.
- You can leave everything else at the default.
Wow, that was easy. It’s really as simple as that to create an S3 bucket.
Enabling Access Logs For ALB
In EC2, click on your load balancer, go to 'Attributes', and click 'Edit'. Click the 'Access logs' toggle to turn access logs on. Click on 'Browse S3' and select the bucket you’ve just created. Don’t forget to save your changes. Whoops, it doesn’t work! I forgot to set the permissions for the bucket, so let’s do that now.
Attaching a Policy to Your Bucket
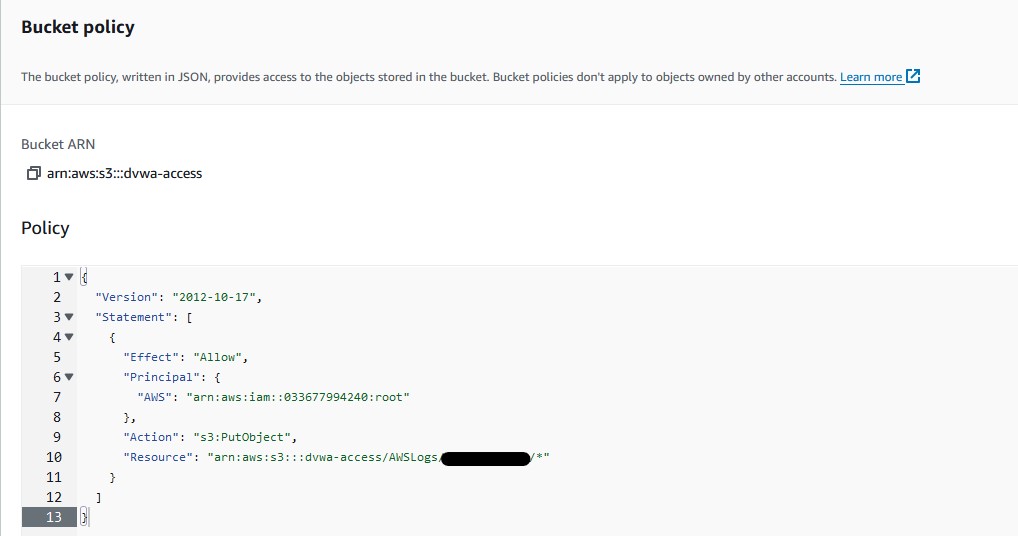
Follow these steps to edit the policy configuration:
- Go into your bucket and click on
'Permissions'. You’ll see an empty bucket policy which you will be able to edit. Amazon provides these policies, so you don’t need to go scrounging for one. Find the policy for your region on this page. - Copy and paste the policy into your bucket and make sure to replace
'elb-account-id'with the ID for your region. - Replace
'my-s3-arn'witharn:aws:s3:::<your_buckets_arn>/AWSLogs/<your_aws_account_id/*. You can find the ARN under'Properties'inside the bucket. - Click on
'Save changes'once you’re finished.
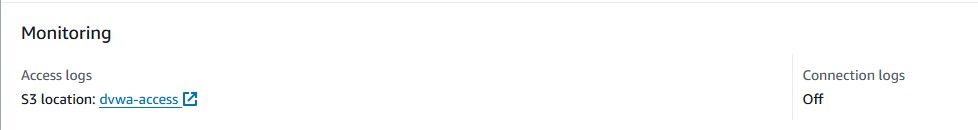
Go back to your load balancer attributes page and save the changes; it should be successful this time.
Viewing the Access Logs
Now how do you actually view the traffic that is being processed by your application load balancer and the requests forwarded to the target group? First, go to your web application and hit refresh a couple of times to generate some test traffic.
Click the link under the load balancer access logs to be taken to the actual S3 bucket, or you can access it through the S3 management console.
You’ll notice that the object directory path is broken down like this:
your_bucket/
├── AWSLogs/
│   └── your_account_id/
│       ├── elasticloadbalancing/
│       │   └── your_region/
│       │       └── year/
│       │           └── month/
│       │               └── day/
│       └── ELBAccessLogTestFile
Click through the objects on the page until you get to gunzip (gz) files that hold your access logs. Click on one of them. You must download the log file first before you can view it. Unzip the file and open it with any text editor you want. Now you have your access logs.
Breaking Down An Access Log File
So what does any of this mean? Let’s take the traffic I generated as an example:
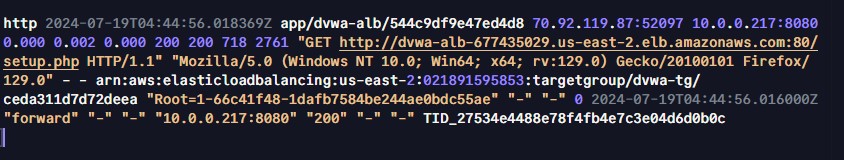
Log Type: http
- HTTP log type.
Timestamp: 2024-07-19T04-44-56-018369Z
- When the request was logged.
Load Balancer: app/dvwa-alb/544c9df9e47ed4d8
- ALB name and ID.
Client IP and Port: 70.92.119.87:52097
- IP and port of the client.
Target IP and Port: 10.0.0.217:8080
- IP and port of the target instance.
ELB Status Code: 200
- Load balancer status code (200 OK).
Target Status Code: 200
- Target status code (200 OK).
Request Size: 718
- Size of the request (in bytes).
These are just some of the most important bits of information provided by the access log output. Understanding your access logs is key to optimizing performance and troubleshooting issues. Take the time and learn what each component of them means and you’ll set yourself up for success.
Food for Thought
- Monitor Trends: Regularly check your logs to spot trends and anomalies.
- Optimize Performance: Use log insights to fine-tune your app’s performance.
- Enhance Security: Look for unusual patterns that could indicate security threats.
- Debug Faster: Logs can be a goldmine for diagnosing issues quickly.
- Stay Proactive: Set up alerts for critical errors or performance issues.
- Review Regularly: Regular log reviews can prevent future problems.
If you liked this post, maybe check out the rest? You can find a variety of my security and networking posts under the 'categories' and 'tags' pages.